优化我们运营中的水的使用并提高水的质量。

水为何如此重要

GRI 303: 103-1, 103-2, 103-3; GRI 306: 103-1, 103-2, 103-3, 306-1
103-1
实质性主题及其边界的解释

103-2
解释管理方法组成部分

103-3
评估管理方法

As a global manufacturing company, Greif has a responsibility to minimize our water use and improve water quality, particularly in our most water intensive operations. Responsible water management reduces our demand for water as water scarcity and water costs are rising and ensures that water discharge from our facilities is treated and safe to protect the health of the communities in which we operate. Our water management practices simultaneously achieve these aims while creating operational efficiencies and minimizing regulatory risk.

治理

Only 1%

total water consumed in regions with high water baseline stress

我们在水质方面的努力已经使我们实现了到2025年减少10%的目标。

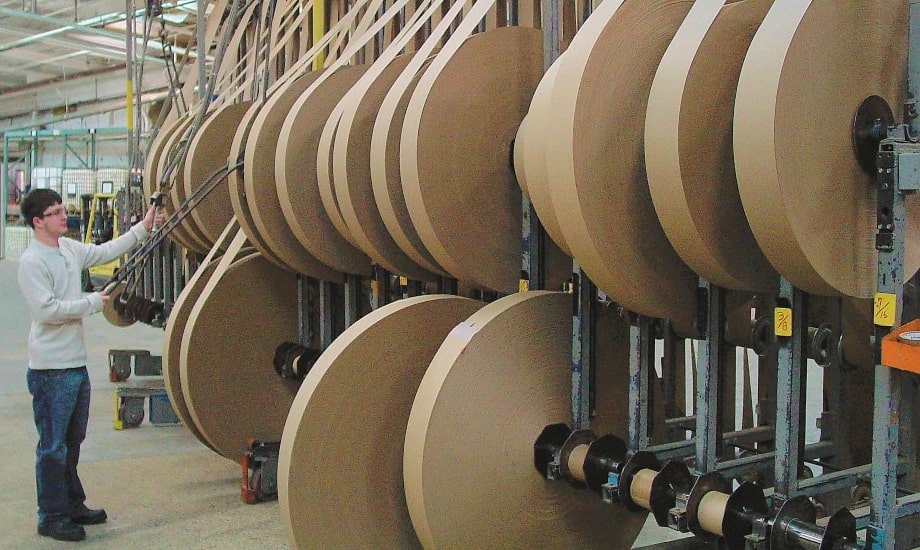
格雷夫 环境健康与安全 (EHS) 政策 provides global guidelines for water conservation to improve water efficiencies in existing operations and incorporate water management in planning for future projects and technology investments. Each Greif facility is expected to manage water locally in accordance with our EHS policy with supervision and support from Greif’s EHS team regarding compliance obligations and best practices for water use, treatment, and recycling. Local management teams are encouraged to improve water efficiencies and quality, reduce water withdrawal to minimize impact to local sources, maintain regulatory compliance and reduce costs related to water. 95 percent of Greif’s water use impact occurs in our 13 paperboard mills within our Paper Packaging and Services (PPS) business. Our water management efforts primarily focus on these mills. In 2020, we continued our efforts to eliminate direct discharge from our mills by converting our Baltimore, Ohio mill to discharging to a local municipal water treatment plant. In addition to removing direct discharge from our operations, this transition reduces Greif’s overall water withdrawal by 400,000 gallons a day. Many of these mills draw on well water from local aquifers, which in turn are discharged into different bodies of water post-use after treatment. We have also continued to implement projects to reduce water use in our mills. For example, at our mill in Los Angeles we replaced nine water oscillators with electromechanical oscillators which reduced well water intake by 2.1 million gallons per year, a 4 percent reduction, in addition to reducing our costs.

Greif monitors Key Performance Indicators (KPIs) to ensure proper treatment of our wastewater. If a treatment incident occurs, the facility manager would observe a change to these KPIs, which initiates an investigation to determine the root cause and resolve the problem. When necessary, Greif engages third-party experts to support our investigations. For example, in 2020 Greif’s Tama mill experienced high biochemical oxygen demand (BOD) and nitrogen concentrations. Greif contracted with a third party to conduct a site inspection and recommend corrective actions. Based on their recommendations, we increased nutrient addition, instituted improved analytical testing to monitor nutrient levels and introduced chemical oxygen demand (COD) testing to receive faster feedback on potential issues.

While Greif’s water impact is predominately in our PPS operations, we take steps to curb water use across all our operations, particularly in water-stressed regions in Latin America, Africa and the Middle East. In these facilities, and across all our operations, we reduce water pressure where it is higher than needed, replace leaky valves and collect and use rainwater when possible. Our Global Industrial Packaging facility in Riyadh, Saudi Arabia implemented many such measures in an effort to reduce and recycle their wastewater, ultimately resulting in a 32 percent reduction in waste to landfill from their facility. Please see our 浪费 page for more information on their achievement.

In 2021, we will develop standard environmental data dashboards across our mills to better understand and manage water and effluent, as well as energy data, and continue working to identify water efficiency opportunities.

目标与进展

In 2017, Greif announced a 2020 goal of 10 percent reduction in kilograms of biochemical oxygen demand (BOD) per metric ton of production, from a 2014 baseline of 1.47, at legacy Greif mills. Our 2017 materiality process led to the creation of new 2025 goals and restating our BOD goal as a 2025 goal. Additionally, in 2021, we plan to create 2030 goals and targets in line with the American Forest and Paper Association.

In 2018, we reevaluated our historical water use and BOD data to confirm our baseline and assumptions to support continual improvement related to water. Through this process, we restated our 2014 BOD baseline to 1.40.

2025 Goal: Reduce BOD discharged in kilograms by 10 percent per metric ton of combined production from the Riverville and Massillon mills using the 2014 restated baseline by the end of fiscal year 2025.

Progress: Since 2017, we have reduced BOD per metric ton of production by 71.8 percent in our legacy Greif containerboard mills. Our significant progress against our BOD goal was enabled by the installation of a wastewater treatment facility at our Massillon mill. Completed in July 2017, the project led to modest improvements in 2017 and far surpassed expectations in 2018. These benefits continued to be realized in 2020.

In 2021, we will continue to track our progress in reducing BOD while controlling specific water use in our mills and reevaluate our goals to include both our legacy Greif mills and Caraustar mills that are now part of our organization. Additionally, in 2021, we will announce new water reduction targets for our mills.

Performance Data

GRI 303-1,306-1,306-5
303-1
Water withdrawal by source
 
306-1
Water discharge by quality and destination
 
306-5
Water bodies affected by water discharges and/or runoff
 

WATER*


2016 财年

2017 财年

2018 财年 

2019 财年

2020 财年

取水量(千立方米)*

8,420.2

9,666.3

9,360.8 

13,864.4

12,936.6

地表水

 -

9,242.7

8,630.0 

10,266.8

10,132.0

地下水

 -

423.6

730.7 

3,597.6

2,804.6

雨水

 -  -  -  - -

废水

- -  -  - -

市政供水†

 -  -  -  - -

废水排放量(千立方米)**

7,961.4

8,983.2

9,316.2 

12,403.92

11,935.1

詹姆斯河

 -

8,788.8

8,907.1 

7,949.5

8,375.0

马西隆市

 -

191.6

407.1 

424.0

355.8

塔斯卡拉瓦斯河

 -

2.8

2.0 

2.5

8.8

Sweetwater Creek^

 -

 -

 -

0.0

0.0

科布县污水处理厂^

 -

 -

 -

844.9

855.0

辛辛那提大都会污水处理区^^

 -

 -

 -

37.6

40.6

密尔沃基大都会污水处理区^^

 -

 -

 -

349.0

335.9

洛杉矶县卫生区 WWTF^^

 -

 -

 -

196.8

189.1

三哩溪^

 -

 -

 -

0.0

-

巴尔的摩村 WWTF**

 -

 -

 -

0.0

6.1

西支 Paw Paw Creek **

 -

 -

 -

697.1

581.4

圣何塞-圣克拉拉地区污水处理厂^^

 -

 -

 -

288.1

334.2

塔科马中央污水处理厂^^

 -

 -

 -

6.9

8.5

菲奇堡市污水处理厂^

 -

 -

 -

322.6

309.0

爱荷华河**

 -

 -

 -

291.8

364.9

樱桃湖**

 -

 -

 -

597.8

550.4

爱荷华支流**

 -

 -

 -

58.0

78.6

生化需氧量(千公斤)

1,050.4

890.4

204.2

3,508.3

3,457.1

总悬浮固体(千克)

546,857

465,098

349,003

1,224,442

1,045,928

磷(公斤)

5,728

4,991

6,617  4,708 4,445

产量(公吨)

665,000

690,000

713,336 

1,729,062

1,661,228

消耗率(立方米3/公吨)

12.7

14.0

13.1 

8.02

7.79

笔记:

  1. 2015 年至 2018 年的数据来自 Greif 的两家造纸厂,其中一家位于弗吉尼亚州里弗维尔,另一家位于俄亥俄州马西隆。从历史上看,这两家造纸厂占 Greif 全球水足迹的 90% 以上。它们分别从詹姆斯河和现场水井取水。2019 年的数据包括 12 家于 2019 年收购和整合的前 Caraustar 工厂。所有 2019 年的数据均为全年数据。我们工厂排放的废水质量符合许可要求。没有其他组织使用排放的水。WWTP = 废水处理厂。
  2. 2019 财年数据包括 Mobile Wright Smith WWTP,该污水处理厂于 2020 年关闭,并已重新陈述,以正确核算 2019 财年 West Branch Paw Paw Creek 的排放量。
*Evaporative losses estimated.
经过初次澄清、二次澄清和曝气处理后直接排放。
采用废水预处理,包括去除可溶性 BOD。
仅使用固体进行废水预处理。
† Greif 目前不跟踪市政供水的取用情况。

 基线水资源压力高或极高地区的用水情况

2020 财年

取水量(千立方米)

170.4

总取水量百分比

1%

用水量(千立方米)

162.7

占总用水量的百分比

1%

数据收集自 24 家 Greif 工厂,这些工厂位于基线水资源压力高或极高的地区,具体定义如下: WRI 的 Aqueduct 水风险地图集 . 格莱夫阿尔及利亚工厂的年度取水量数据是根据自 2003 年左右安装水井以来的总取水量估算得出的。百分比仅以格莱夫造纸包装和服务业务工厂运营用水量的百分比来报告,估计占格莱夫总取水量和消耗量的 95%。格莱夫目前不报告所有工厂的全球用水量数据。
精彩故事

Improving Our Wastewater

In 2017, Greif’s Massillon, Ohio mill completed construction of a water treatment facility to significantly reduce the biological oxygen demand (BOD) of the plant’s discharge water before being returned to the municipal treatment plant. High BOD levels promote bacteria growth, release odors and must be controlled using chemicals. Since installing the treatment facility, we reduced BOD discharged to the municipal system by over 96 percent, contributing to our 2025 BOD reduction goal. This also eliminated several chemicals that were previously needed to control bacteria.

突出显示通用最小 1
精彩故事

Water Reduction at Our Baltimore, Ohio Mill

In 2020, Greif’s Baltimore, Ohio mill transitioned from direct discharge of treated wastewater to a local creek to discharging pretreated wastewater to a local water treatment facility that uses a state-of-the-art membrane treatment system to further treat water. This shift both reduced overall water discharge and supported returning cleaner water to the community. Greif engaged with local and state governments over the course of multiple years to design and approve the project, which was approved in 2019 and completed in October 2020. The project will reduce water consumption by 550,000 m3 per year. The community benefits from a cleaner surface water since several tons per year of biological oxygen demand and total suspended solids were also removed from the local creeks because of this transition.

巴尔的摩高亮纸卷 最少 1

可持续发展亮点

Only 1%

Total water consumed in regions with high water baseline stress

我们在水质方面的努力已经使我们实现了到2025年减少10%的目标。

71.8%

降低生化需氧量

看不到您的语言?

使用 Google 翻译从页面顶部的工具栏列表中选择您的语言。