Why Climate Strategy Matters
Governance
B
Greif’s 2021 CDP Score
Demonstrating excellence in carbon management, governance, strategy and best practices, and outperforming the overall and North American average CDP score of C.
Our carbon footprint and climate responsibility stretch across the lifecycle of our products – from the extraction of raw materials to the use and end-of-life of our products. Since 2010 Greif has maintained a Global Climate Team[1], comprised of representatives from all business units and regions, responsible for providing support, guidance and direction to facilities to identify energy and emissions reduction projects. The team is also responsible for helping facilities develop roadmaps and track progress towards our 2030 target. In 2019, we restructured the team to place an increased emphasis on including regional leadership to better engage and identify opportunities within each business unit and legacy Caraustar facilities. This change in structure has streamlined our energy roadmap process, allowing us to focus on and invest in the business units and facilities that have the most impactful opportunities.
This year, our Leadership Council focused on sustainability, with one subgroup of the council dedicated exclusively to climate. The council and the Climate Team held quarterly meetings to determine action items that need to be taken to drive progress towards our 2030 emissions target, increase awareness of our climate objectives throughout the organization and create accountability, reporting directly to the CEO to update and collaborate on environmental targets and initiatives.
This year, our Leadership Council focused on sustainability, with one subgroup of the council dedicated exclusively to climate. The council and the Climate Team held quarterly meetings to determine action items that need to be taken to drive progress towards our 2030 emissions target, increase awareness of our climate objectives throughout the organization and create accountability, reporting directly to the CEO to update and collaborate on environmental targets and initiatives.
Energy efficiency is a consideration in capital deployment. We include ESG in the criteria for capital requests as part of our capital allocation system and to further demonstrate the inclusion of ESG impact on our business. We screen for ESG benefits such as reduced energy consumption, reduced raw material usage, and increased health and safety of people and products in our decision-making process. Whereas each facility was responsible previously for developing its own roadmap, regional leadership is now responsible for collaborating with each business unit to identify energy reduction and efficiency opportunities.
In 2021, we implemented 23 energy efficiency projects, resulting in more than $440,000 of savings across our organization. These projects include replacing equipment and updating processes that reduce energy demand, such as replacing ovens, air compressors and boilers, adjusting water temperatures and implementing energy efficiency practices, such as lighting and HVAC replacements. For more information about our energy efficiency projects, please see section C4.2 and C4.3b of our 2021 CDP Climate Response.
In 2020, we conducted a gap analysis of our current climate management practices against the Task Force on Climate-related Financial Disclosure (TCFD) recommendations to identify priority areas of focus to advance our climate strategy and modeled potential climate targets under multiple temperature scenarios. This work led to the identification and approval of our new 2030 emissions target and revealed a need to conduct a more detailed scenario analysis to better understand both our transitional and physical climate-related risks and opportunities. As a result of the TCFD and climate strategy work, we implemented actions to improve governance through quarterly Sustainability Management Team meetings with the Sustainability Steering Committee, the Leadership Council’s focus on sustainability, and quarterly meetings between the VP of Sustainability, Chief of Marketing and the CEO. We report KPIs in the monthly Greif Business Systems (GBS) book, the monthly Must Win Battle (MWB) scorecard and in the CEO’s enterprise scorecard. We also include the ESG KPIs in our monthly and quarterly slide decks which managers use to keep their teams accountable.
In 2021, we held a series of internal climate risk workshops to better understand the climate-related risks and opportunities our business faces. Through the workshops, colleagues from cross-functional departments and across our global footprint collaborated to identify, rank and evaluate regulatory, market and physical climate-related risks and opportunities. Through these workshops we identified the most significant risk and opportunities to our business. We then conducted a scenario analysis and financial modeling to better understand the potential impacts to our business. The teams created a list of action items for Greif to mitigate and manage risks as well as strategies to capitalize on the opportunities. The outcomes of this work will be further integrated into our business strategy and risks management process. To learn more about our enterprise risk management process, please visit the Risk Management & Business Continuity section of our sustainability report.
|
Risk / Opportunity |
Topic |
Description*
|
|---|---|---|
|
Risk |
Natural catastrophe |
Large flood/hurricane/earthquake/windstorm, etc. leading to loss of key or valuable production facility (one or multiple). |
|
Risk |
Carbon pricing mechanisms |
Carbon pricing regulations, such as cap-and-trade systems and carbon taxes, are currently impacting Greif in some markets (Europe and North America) and may emerge in other regions. This manifests as a substantial and growing expense. |
|
Risk |
Inefficient investments / capital planning |
A lack of resources to fully understand the impact regulatory changes may have on strategic decisions and investments may lead to a sub-optimal capital allocation. This includes facilities becoming obsolete more quickly than expected as well as a lower-than-expected ROI.
|
|
Risk |
Resilience / production continuity |
Exceptional organizational capabilities, associated business resilience, preparedness and agility will allow Greif to resume production levels more rapidly and better support colleagues, customers, and communities over time should disruptions and catastrophes become more common.
|
|
Risk |
Direct environmental catastrophe
|
Major climate/weather related event at key facilities such as Delta, Vreeland, Paper Mill operations leading to a major environmental event, financial event, as well as potentially leading to public relations/image issues.
|
| Risk and Opportunity | Shift in customer preferences | The demand for sustainable products is increasing. The risk that Greif is not moving fast enough to respond to the increasing use of recycled materials in production processes could reduce demand for Greif’s products and services. Additionally, climate-related regulations that limit the end markets of Greif products, such as the oil and gas industry, can ultimately limit Greif’s business by decreasing demand for its products and services in key markets. Greif can capitalize on this opportunity by growing our sustainable product portfolio quickly. |
| Opportunity | Impact on Greif's Recycling Business | Higher ambition climate scenarios rely on increasing steel and plastic recycling rates. If positioned appropriately, Greif may be able to increase the scale of its current reconditioning practice. |
|
Opportunity |
Resilience
|
Exceptional organizational capabilities associated with business resilience, preparedness and agility will allow Greif to resume production levels more rapidly and better support colleagues, customers and communities over times should disruptions and catastrophes become more common. |
*Please see Greif’s 2021 CDP Climate Change Response for additional information
[1] Formerly the Global Energy Team
Goals & Progress
In 2020, we conducted a detailed analysis and evaluation with a third party of our ability to commit to a goal that would be approved by the Science Based Target Initiative (SBTi). We then announced our commitment to reduce our Scope 1 and Scope 2 emissions by 28 percent by 2030, from a 2019 baseline. This new target is aligned with prevailing climate science to limit overall global warming to well below 2 degrees Celsius and builds upon the Company’s 11 percent emissions reduction per unit of production accomplishment in 2020. By the end of 2023, Greif will also complete an assessment of its Scope 3 emissions and determine the feasibility of a long-term net zero emissions aspiration in alignment with the Science Based Targets Initiative.
In 2021, we focused on improving data collection while continuing to advance the energy efficiency of our operations. These efforts included conducting studies to determine the percentage of our facilities that have transitioned to LEDs and laying the groundwork to begin metering and sub-metering. Four of our production facilities achieved ISO 50001 certification for energy management. We also started to develop roadmaps for 2030. One component of our long-term roadmap is the implementation of Virtual Power Purchase Agreements (VPPAs). In 2022, we will commence work on phases one and two of this project which includes engaging with internal stakeholders, developing our strategy and completing RFPs to select developers. In 2022, we will also develop and publish a holistic energy policy that includes procurement and sustainability elements.
2030 Goal: Reduce absolute Scope 1 and Scope 2 GHG emissions 28 percent over a 2019 baseline. Greif will also complete an assessment of Scope 3 emissions and determine the feasibility of a long-term net zero emissions aspiration by the end of 2023.
Performance
|
|
FY 2017 |
FY 2018 |
FY 2019 |
FY 2020 |
FY 2021 |
|---|---|---|---|---|---|
|
Energy |
|||||
|
3,058,000 |
3,103,200 |
5,398,000 |
5,423,000 |
5,832,000 |
|
- |
- |
Baseline |
- |
-0.3% |
|
GHG Emissions (Metric Tons) |
|||||
|
367,700 |
376,700 |
686,000 |
692,900 |
696,900 |
|
416,000 |
415,900 |
622,200 |
589,500 |
556,900 |
|
3,089,000 |
2,867,090 |
4,407,000 |
4,148,000 |
4,357,000 |
|
3,872,700 |
3,659,600 |
5,715,200 |
5,430,400 |
5,610,800 |
|
- |
- |
Baseline |
- |
4.1% |
Notes:
- Total Energy includes biomass and non-renewable fuel, renewable and non-renewable electricity, and purchased steam consumed.
- FY2019 scope 2 emissions have been restated since 2021 because of Greif’s revised energy use data.
- The reduction for FY2021 is calculated using FY2019 as the baseline year.
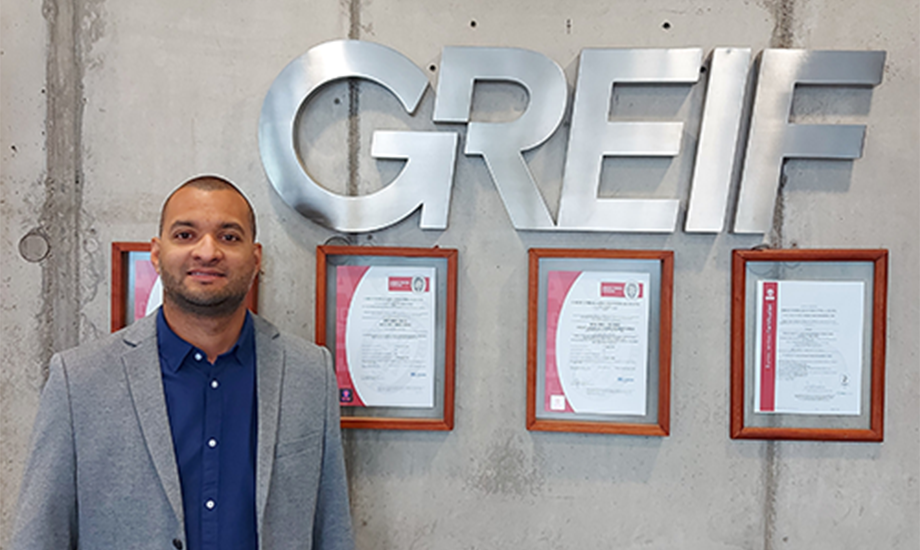
Greif Pudahuel in Chile Achieves 100% Renewable Energy
Greif’s Pudahuel steel plant in Chile was our first facility in Latin America to operate on 100 percent renewable power. Through a two-year project, in partnership with energy provider IMELSA ENERGIA, the facility was able to move its entire electricity supply to 100 percent renewable sources. The facility produces large steel drums, conical drums and water bottles for the chemicals, lube oil and food and beverage markets. This switch advances our sustainability strategy, supports our 2030 GHG emissions reduction goal and helps support our customers’ Scope 3 emissions reductions goals.
Emission Reduction Credits (ERCs)
In an attempt to lower Greif’s emissions of air pollutants such as Nitrogen Oxides (NOx) Volatile Organic Compounds (VOCs), Greif’s paperboard mills in Los Angeles, California and Fitchburg, Massachusetts replaced equipment with more energy efficient technology that reduces air pollutants. Operations in Massachusetts, alone, saved 96 tons of NOx and 27 tons of VOCs in a single year. The updates also allowed Greif to take advantage of Cap-and-Trade programs in California and Massachusetts that provide ERCs for similar activates. In 2019, Greif was awarded $1,037,100 in ERCs through these programs.
Transitioning to Electric Forklifts
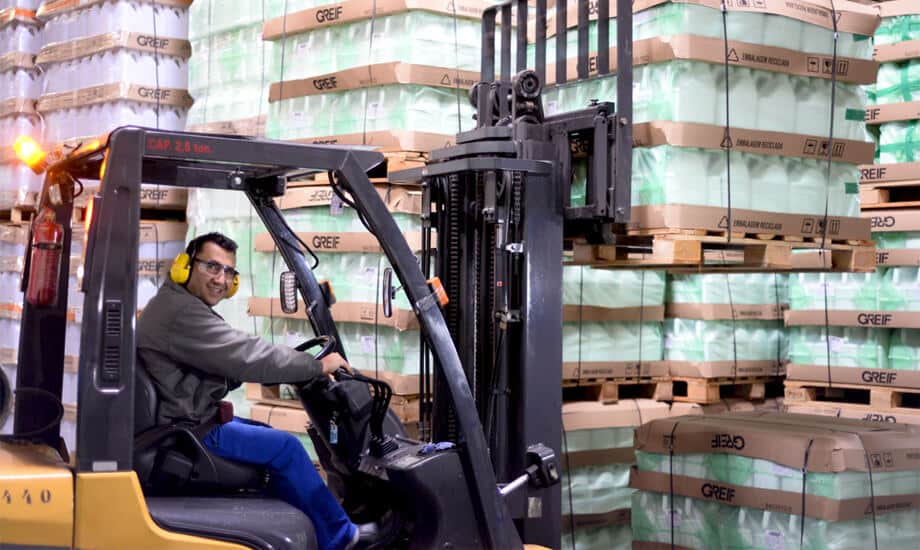
As part of our overarching goal of having more efficient and sustainable equipment, in 2018 we began transitioning our fleet of forklifts from being powered by combustion gasoline to electricity, which reduces our forklift emissions approximately 50 percent. Through 2021, we have converted 85 percent of our forklifts in EMEA to electricity power and realized a cost savings of $365,000. Due to the success of the program, and in support of our overall Renewable Forklift Policy, the program will be rolled out globally. In addition to the environmental benefits, the transition provides a safer working environment for our colleagues by reducing the need to keep containers of gasoline in our facilities.
Energy Efficiency in Production
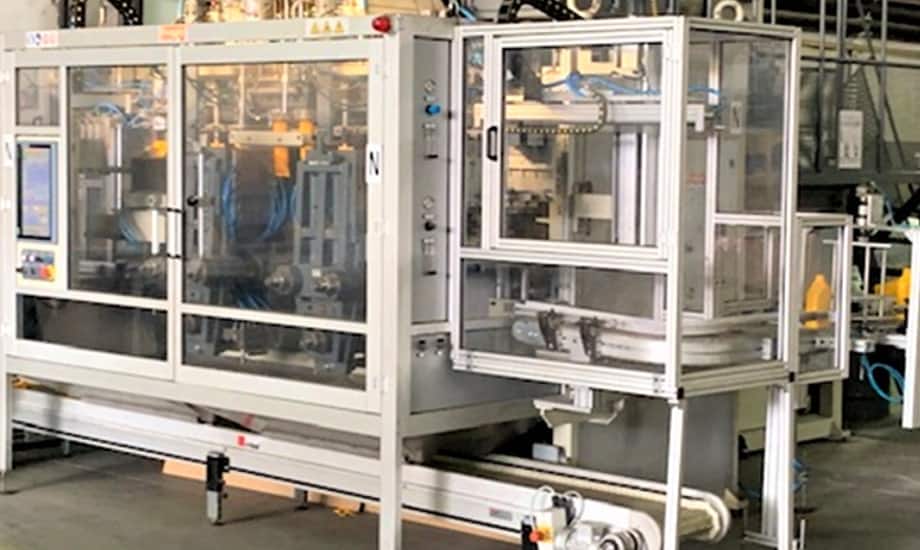
Greif recently made a large-scale investment in a new blow molding machine used to manufacture Greif’s plastic jerrycans at our Casablanca, Morocco plant. The new machine uses up to 30 percent less energy than older generation machines while also delivering significantly higher productivity levels. The new equipment increases production capacity by up to 25 percent for our one- to five-liter bottles and is designed to optimize and reduce raw material usage, extending the environmental benefit of the machine beyond energy use.
The team in Morocco also implemented other energy efficiency projects such as eliminating air leakages in our plastic and steel plants, replacing hydraulic extruders with electric ones on four machines, upgrading old equipment and replacing DC motors with AC motors on several blow molding machines that help to significantly reduce our energy consumption.
Advancing Renewable Energy
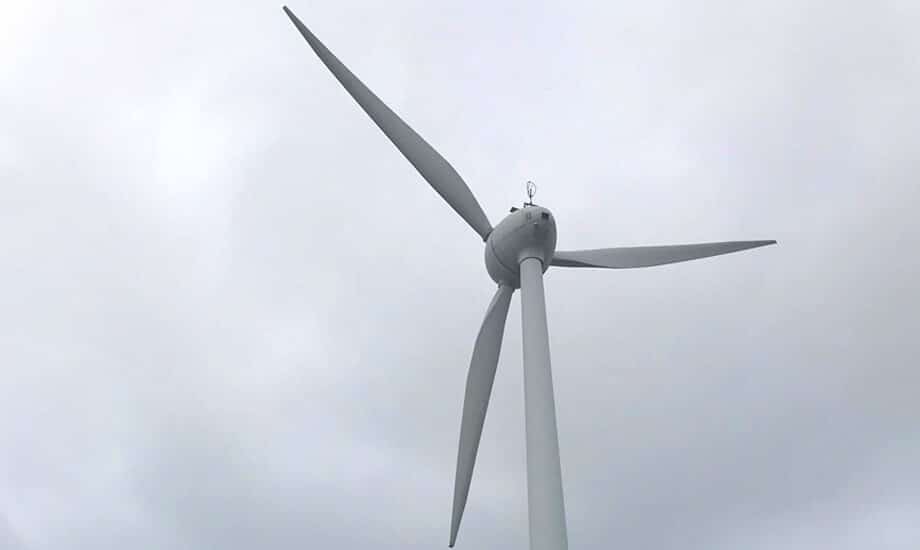
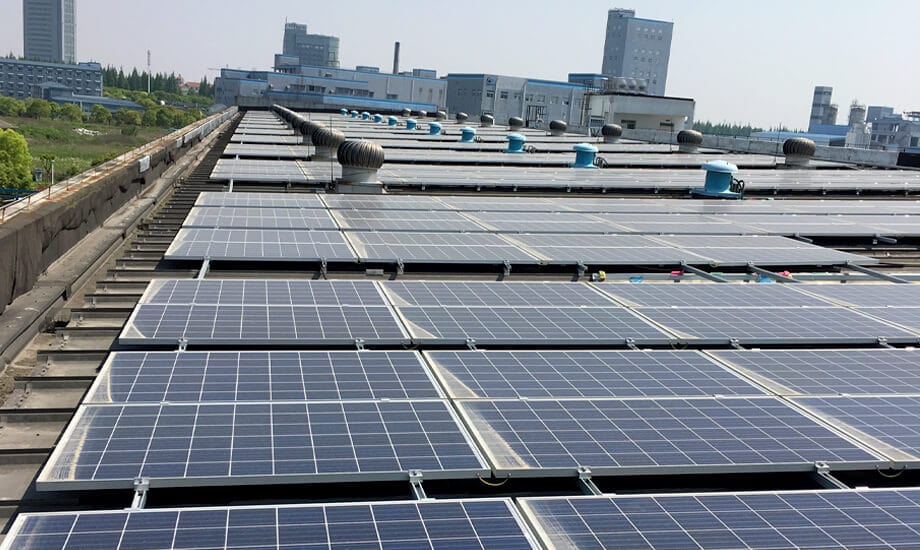
Renewables, such as biomass, solar and wind energy, will play a major role in addressing the challenges of climate change over the long term. We are committed to testing and expanding the use of renewable energy technologies across our global operations when doing so is economically viable and in the best interest of our stakeholders. Across our global operations, we have installed over 6,900 solar panels capable of 1.87 million kilowatt-hours (kWh) of solar production. Due to our continued investment, renewables now account for 12 percent of Greif’s energy use.
In North America, we have installed more than 2,000 solar panels in seven facilities, delivering 760,000 kWh of energy and saving more than $112,000 annually.
In 2016, three of our largest Brazilian plants began sourcing their energy partly through renewable resources. In 2017, we expanded the program to three additional plants in Brazil, reducing emissions by 70 percent and saving $1.4 million USD annually.
In April 2017, Greif’s Shanghai RIPS facility completed installation of solar panels, converting 15.4 percent of the facility’s electricity to a renewable source and saving over $16,000 USD annually. Throughout our China operations, we source renewable energy through 4,800 solar panels via energy purchase contracts.
Our Turkey FPS operations produce over two million kWh of energy through wind turbines and windmills.
In 2020 and 2021, we installed solar panels on the roof of our Israel facility. These panels provide emissions savings of 748 tons of CO2 annually, converting 12 percent of the facility’s annual energy consumption to clean solar energy and supporting reduced heating and cooling costs.
In 2021, solar panels at our two facilities in Ede, Netherlands produced over 1 million kWh of electricity.
EPA’s SmartWay Transport Partnership
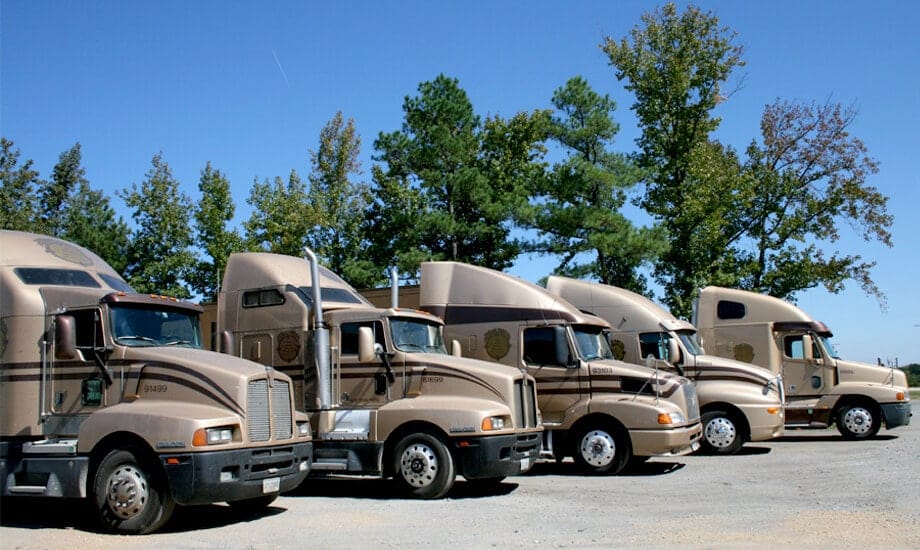
To manage logistics in an environmentally-responsible manner, Greif uses carriers that are approved through the EPA’s SmartWay initiative whenever possible. We include SmartWay certification during our new carrier certification process. Greif’s SmartWay-approved carrier base accounts for 77 percent of total miles traveled.
SUSTAINABILITY HIGHLIGHTS
12%
Energy Sourced From Renewables
We continue to invest in cost-effective renewable energy projects that reduce our greenhouse gas footprint.
B
Greif's 2021 CDP Score
Demonstrating excellence in carbon management, governance, strategy and best practices, and outperforming the overall and North American average CDP score of C.


