


זיכויים להפחתת פליטות (ERC)
בניסיון להוריד את פליטת מזהמי האוויר של Greif כמו תחמוצות חנקן (NOx) Volatile Organic Compounds (VOCs), מפעלי הקרטון של Greif בלוס אנג'לס, קליפורניה ופיצ'בורג, מסצ'וסטס החליפו את הציוד בטכנולוגיה יעילה יותר באנרגיה המפחיתה מזהמי אוויר. הפעילות במסצ'וסטס, לבדה, חסכה 96 טון של NOx ו-27 טון של VOC בשנה אחת. העדכונים גם אפשרו ל-Greif לנצל את היתרונות של תוכניות Cap-and-Trade בקליפורניה ומסצ'וסטס המספקות ERC עבור הפעלה דומות. בשנת 2019, הוענק ל-Greif $1,037,100 ב-ERCs באמצעות תוכניות אלה.
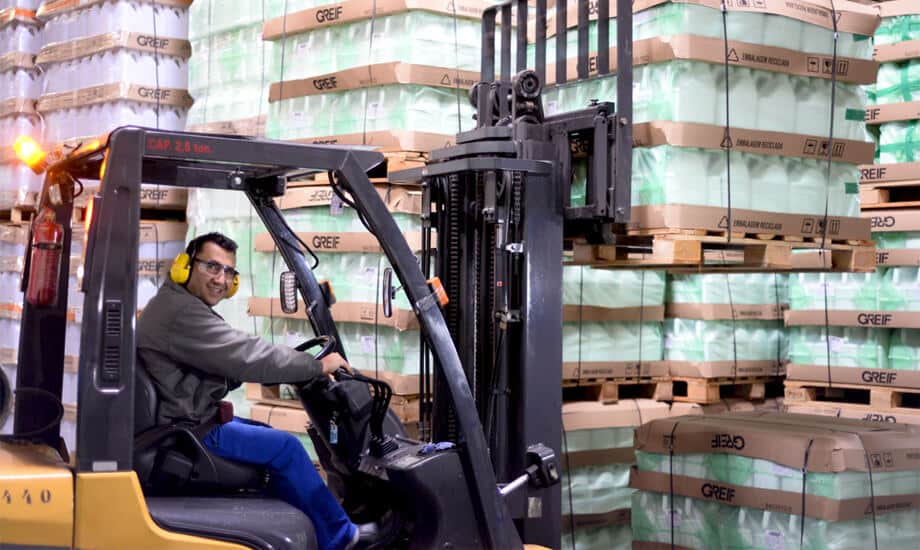
מעבר למלגזות חשמליות
כחלק ממטרת העל שלנו להחזיק בציוד יעיל יותר ובר קיימא, בשנת 2018 התחלנו להעביר את צי המלגזות שלנו מלהיות מונעות על ידי בנזין בעירה לחשמל, מה שמפחית את פליטת המלגזות שלנו בכ-50 אחוז. עד שנת 2020, המרנו 99 אחוז מהמלגזות שלנו ב-EMEA לחשמל, בעוד שצמצמנו את גודל הצי ב-17 אחוזים והשגנו חיסכון בעלויות של $352,000 בשנת 2020. בצפון אמריקה, החלפנו 2 אחוזים מהצי שלנו וחסכנו $20000, עד 250, ו- $2000000, ו- תוכנית. כתמיכה במדיניות הכוללת שלנו בנושא מלגזות מתחדשות, התוכנית תמשיך להיות מושקת ברחבי העולם. בנוסף ליתרונות הסביבתיים, המעבר מספק סביבת עבודה בטוחה יותר עבור עמיתינו על ידי הפחתת הצורך להחזיק מיכלי בנזין במתקנינו.
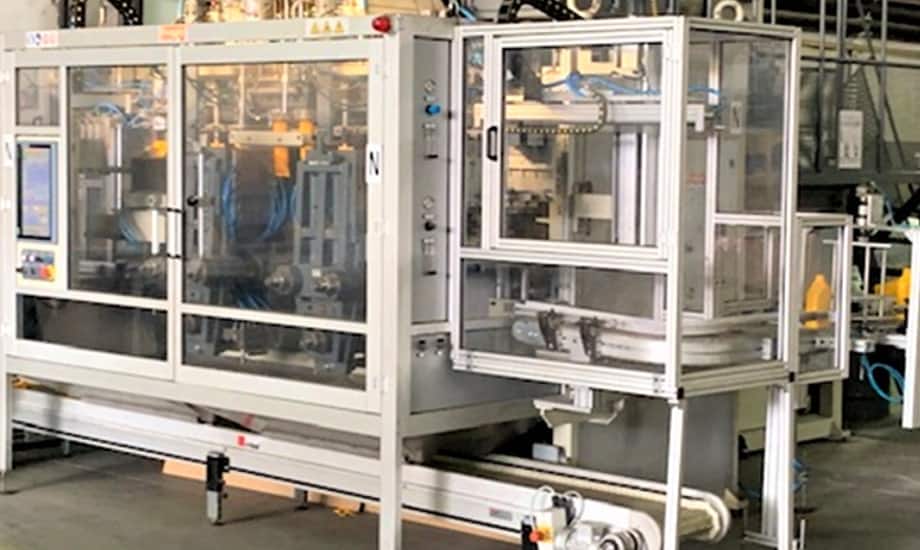
יעילות אנרגטית בייצור
Greif ביצע לאחרונה השקעה בקנה מידה גדול במכונת דפוס חדשה המשמשת לייצור ג'ריקנים מפלסטיק של Greif במפעל שלנו בקזבלנקה, מרוקו. המכונה החדשה צורכת עד 30 אחוז פחות אנרגיה ממכונות מהדור הישן, תוך שהיא מספקת רמות פרודוקטיביות גבוהות משמעותית. הציוד החדש מגדיל את כושר הייצור של עד 25 אחוז עבור בקבוקי ה-1 עד חמישה ליטר שלנו ונועד לייעל ולהפחית את השימוש בחומרי גלם, ולהרחיב את התועלת הסביבתית של המכונה מעבר לשימוש באנרגיה.
הצוות במרוקו גם יישם פרויקטים אחרים של יעילות אנרגטית כגון ביטול דליפות אוויר במפעלי הפלסטיק והפלדה שלנו, החלפת מכבשים הידראוליים בחשמליים בארבע מכונות, שדרוג ציוד ישן והחלפת מנועי DC במנועי AC במספר מכונות יציקת מכונות שעוזרות להפחית משמעותית את צריכת האנרגיה שלנו.
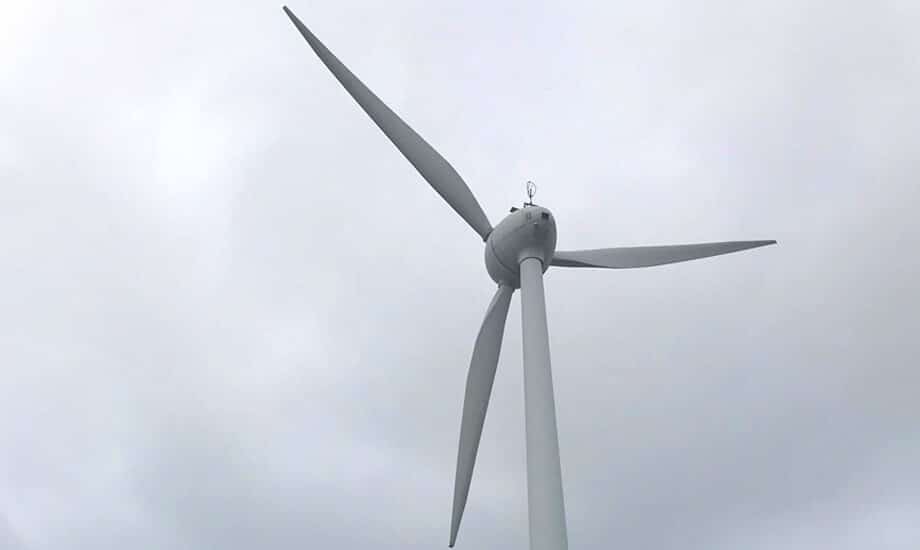
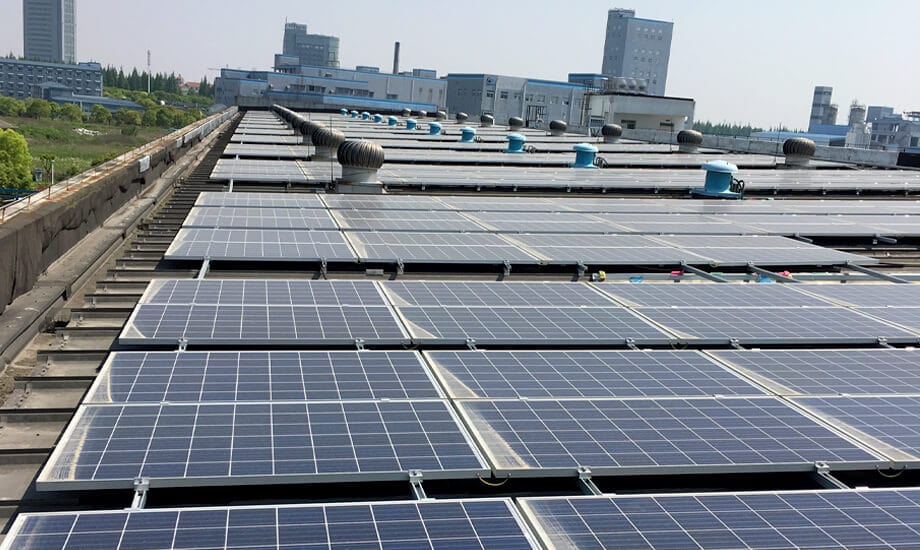
קידום אנרגיה מתחדשת
אנרגיה מתחדשת, כגון ביומסה, אנרגיית שמש ורוח, ישחקו תפקיד מרכזי בהתמודדות עם אתגרי שינויי האקלים בטווח הארוך. אנו מחויבים לבחון ולהרחיב את השימוש בטכנולוגיות אנרגיה מתחדשת על פני הפעילות הגלובלית שלנו כאשר לעשות זאת כדאי כלכלית ולטובת מחזיקי העניין שלנו. בכל הפעילות הגלובלית שלנו, התקנו למעלה מ-6,800 פאנלים סולאריים המסוגלים לייצר 1.84 מיליון קילוואט שעות של ייצור סולארי וחיסכון שנתי של $120,000. בשל ההשקעה המתמשכת שלנו, אנרגיה מתחדשת מהווה כעת 12 אחוז מצריכת האנרגיה של Greif.
בצפון אמריקה, התקנו יותר מ-2,000 פאנלים סולאריים בשבעה מתקנים, מספקים 640,000 קילוואט שעות (קוט"ש) של אנרגיה וחוסכים יותר מ-$100,000 בשנה.
בשנת 2016, שלושה מהמפעלים הגדולים שלנו בברזיל החלו לשאוב את האנרגיה שלהם בחלקה באמצעות משאבים מתחדשים. בשנת 2017, הרחבנו את התוכנית לשלושה מפעלים נוספים בברזיל, צמצמנו את הפליטות ב-70 אחוז וחסכנו $1.4 מיליון דולר בשנה.
באפריל 2017, מתקן RIPS בשנחאי של Greif השלים התקנת פאנלים סולאריים, תוך המרת 15.4 אחוזים מהחשמל של המתקן למקור מתחדש וחיסכון של למעלה מ-$16,000 דולר בשנה. לאורך כל פעילותנו בסין, אנו מייצרים אנרגיה מתחדשת באמצעות 4,800 פאנלים סולאריים באמצעות חוזי רכישת אנרגיה.
פעולות ה-FPS שלנו בטורקיה מייצרות יותר משני מיליון קילוואט-שעה של אנרגיה באמצעות טורבינות רוח וטחנות רוח.
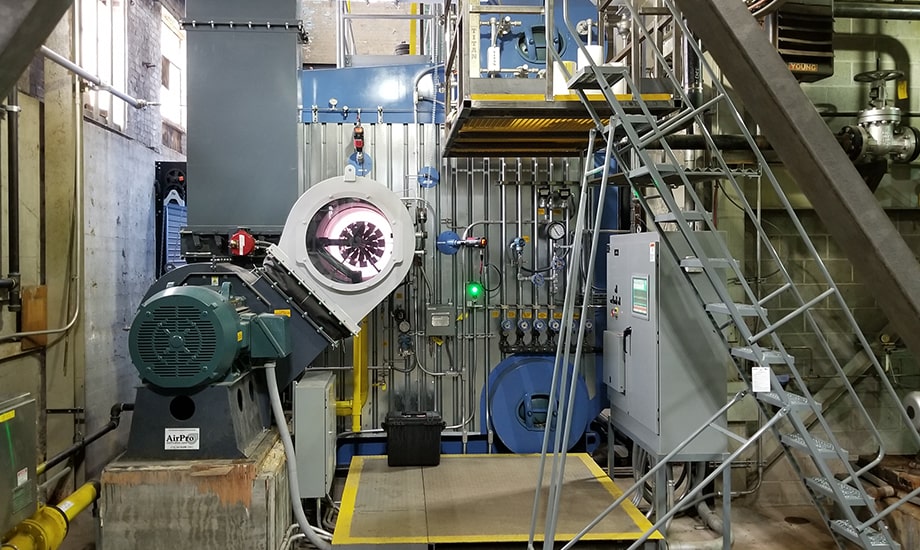
החלפת הדוד עם 10% שיפור יעילות אנרגטית
מפעל הקרטון של גרייף בפיצ'בורג, מסצ'וסטס הפעילה דוד שהותקן בתחילה כדי לתמוך בשתי מכונות נייר. הדוד היה מגודל לצורכי תפעול הטחנות וכתוצאה מכך לא פעל בצורה יעילה ככל האפשר וגרם לבעיות אמינות. בשנת 2019 נרכש דוד חדש על מנת לאפשר יעילות ואמינות קיטור משופרים. בשל שיפורים אלו, הדוד החדש צפוי לייצר 15,811,200 קילוואט ו-$324,000 חיסכון בשנה.
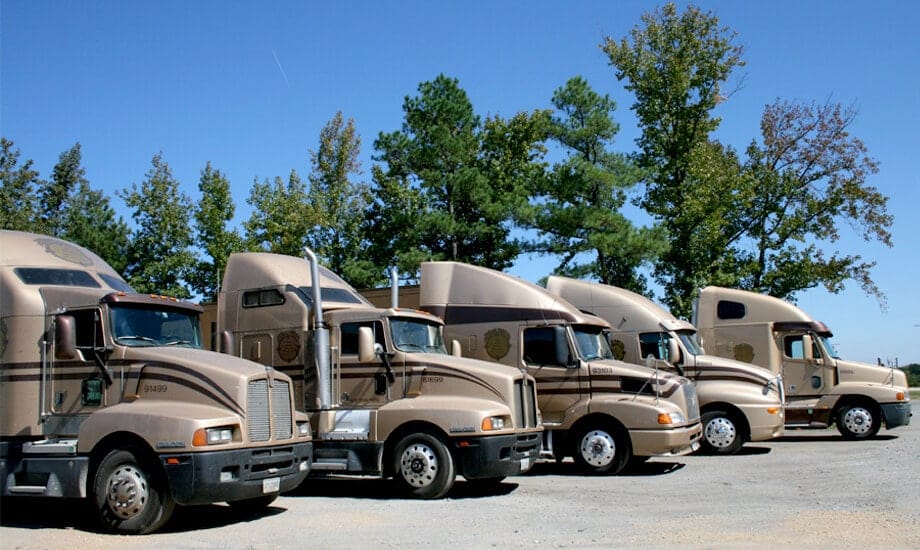
שותפות SmartWay Transport של EPA
כדי לנהל לוגיסטיקה בצורה אחראית לסביבה, Greif משתמש בספקים המאושרים באמצעות יוזמת SmartWay של ה-EPA בכל עת שאפשר. אנו כוללים אישור SmartWay במהלך תהליך הסמכת הספק החדש שלנו. בסיס הספקים המאושר על ידי SmartWay של Greif מהווה 77 אחוז מסך הקילומטרים שנסעו.