Buscar
Filtros genéricos
Coincidencias exactas únicamente
Buscar en el título
Buscar en el contenido
Buscar en el extracto

Desperdiciar

Working towards a zero waste to landfill organization.

Why Waste Matters

GRI 301: 103-1, 103-2, 103-3; GRI 306: 103-1, 103-2, 103-3
103-1
Explanation of the material topic and its Boundary

103-2
Explain management approach components

103-3
Evaluate management approach

Reducing our operational waste, waste to landfill and packaging waste is fundamental to our business. We work to establish closed loop and zero waste processes that support our circularity strategy and the transition to a more circular economy. Our waste reduction efforts add value throughout our supply chain by reducing emissions and environmental impacts, conserving valuable resources through lower material use and helping the communities we serve. We also provide value to our customers by providing lighter weight and more cost-effective products. Through our waste reduction efforts, we reduce emissions in our operations and contribute to addressing global environmental waste challenges.

Gobernancia

71%

of waste diverted from landfills

Our efforts to reduce waste are global, with each facility working towards our 2025 goal.

The Global Waste Team, comprised of 14 Greif colleagues with representatives from each business unit and region, meet monthly to discuss our waste reduction strategies. The Waste Team holds facility management accountable for managing and reducing waste. Greif implements colleague engagement strategies to encourage production colleagues to focus on waste reduction. Greif’s Environmental Health & Safety (EHS) policies, procedures and training govern the labeling, handling, storage and transportation of hazardous waste. As part of our Compliance Management System (CMS), we require all facilities to report waste data monthly. The CMS allows us to collect data, monitor performance and measure progress accurately and efficiently. In 2020, we integrated all of the legacy Caraustar facilities into our CMS allowing us to now track and report waste data for all of these facilities and began collecting waste invoices to improve our verification process. Our waste data is subject to evaluation and verification by our internal audit team to ensure consistency and reliability.

For all facilities, excluding legacy Caraustar facilities, we create a detailed waste matrix to help us understand each facility’s waste streams, each waste stream’s disposal method (recycling, reuse, landfilling, etc.) and manage progress. The waste matrices also serve as a collaboration tool allowing facilities to compare management of common waste streams. We are expanding collaboration between our facilities through monthly or quarterly town halls during which facility success stories and key learnings are shared with a wider audience across our Global Industrial Packaging (GIP) business. We are also improving collaboration and transparency with our waste collection partners supporting our continued waste management progress and our understanding of our waste streams at a more detailed level.

Management at each facility, excluding legacy Caraustar facilities, that has not yet reached our 2025 waste diversion target is responsible for creating a quarterly, or semi-annual, roadmaps to evaluate all waste streams going to landfill and develop a diversion strategy. Each facility includes at least the top three waste diversion projects and reports on associated cost reductions, waste to landfill reductions and the status of each project. Our waste diversion roadmaps provide great insight into our facilities and their waste management progress. For example, the Greif Hadımköy team in Turkey utilized their waste roadmap to assess their waste streams and reach their facility’s 90 percent waste diversion goal.

In 2018, Greif entered into a partnership with Operation Clean Sweep (OCS), an organization dedicated to keeping plastics out of the environment, to expand our commitment to reducing plastic waste. Through the partnership, we commit to conducting audits in our facilities to evaluate our plastic resin handling operations and implement good housekeeping and pellet, flake and powder containment practices. We have conducted audits at our Hazleton, Pennsylvania, Houston, Texas and Mt. Sterling, Kentucky locations and will resume conducting audits when able to do so safely in light of the COVID-19 pandemic.

In 2021, we will continue to integrate legacy Caraustar facilities into our waste management goals and construct a roadmap towards reaching our 2025 target. We are also evaluating the long-term and strategic impact of waste reduction to our business and our customers in support of establishing a new 2030 waste goal. We will continue to work with our customers to meet their sustainability goals.

Goals & Progress

In 2018, we created a goal to divert 90 percent of waste from landfills from all Greif production facilities globally by the end of fiscal year 2025. This year we began to include waste data from our legacy Caraustar facilities as well. Globally, we diverted 71 percent of waste from landfills in 2020.

Progress:

 FY 2020*

facilities with 90%+ Diversion

facilIties with 99%+ Diversion

facilIties with zero waste to landfill

Total

109

45

39

América del norte

38

8

5

Europe

51

31

29

América Latina

8

0

0

Asia Pacífico

12

6

5

*Data accounts for production facilities and offices from our Soterra land management business only. 

Actuación

GRI 301-3,306-2
301-3
Reclaimed products and their packaging materials

306-2
Waste by type and disposal method

WASTE STREAM


FY 2017

FY 2018

Año fiscal 2019

Año fiscal 2020

Hazardous Waste  


Total Waste to Landfill

527

1,639

2,428

3,608

Waste to Landfill

527

1,292

1,161

2,989

Incinerated (no energy recovery)****

-

347

1,267

619

Total Non-Landfill*

7,109

14,105

20,725

19,199

Incinerated (with energy recovery)**

1,202

3,372

4,073

3,275

Composted***

-

0

0

1

Recycled†

2,011

7,604

14,084

14,160

Reused††

399

1,513

651

706

Reclaimed†††

194

217

366

376

Miscellaneous (Non Landfill) ††††

3,303

1,399

1,551

681

Total Hazardous Waste

7,638

15,744

23,153

22,807

Non-Hazardous Waste


Total Waste to Landfill

57,403

54,594

33,837

137,211

Waste to Landfill

57,403

54,110

33,380

137,066

Incinerated (no energy recovery)****

 -

485

457

151

Total Non-Landfill*

161,796

257,219

184,357

326,546

Incinerated (with energy recovery)**

945

2,054

2,950

17,006

Composted***

15,277

35

15,784

49,734

Recycled†

111,861

231,997

141,217

212,075

Reused††

17,147

11,641

12,321

19,441

Reclaimed†††

13,187

9,439

9,847

11,701

Miscellaneous (Non Landfill)††††

3,379

2,052

2,239

16,589

Total Non-Hazardous Waste

219,199

311,813

218,194

463,757

Total Waste (Hazardous & Non-Hazardous)

226,835

327,557

241,347

486,564

Notes:

  1. Legacy Caraustar facilities were incorporated into waste reporting in FY 2020.

*Non-Landfill: Includes chemical-physical, incineration with energy recovery, recycled, reused, reclaimed, composted and fuels blending treatment methods 
**Incinerated (with energy recovery): Treatment method involving the combustion of solid waste that results in energy capture.
***Composted: Treatment method involving the biological decomposition of solid or liquid operational waste.
**** Incinerated (no energy recovery): Treatment method involving the combustion of solid waste that does not result in energy capture.

†Recycled: Treatment method involving the separation, preparation and sale of recyclable materials to end-user manufacturers.
††Reused: Treatment method involving the use of a material for its original purpose multiple times.
†††Reclaimed: Treatment method involving the process of extracting and converting materials from recycled materials to be used again.
†††† Miscellaneous (Non Landfill): All other treatment methods not mentioned previously, including Deep Well Injection and On-Site Storage, which were reported separately in 2017.

EARTHMINDED LIFE CYCLE SERVICES – ESTIMATED DRUMS AND IBCS RECONDITIONED*


FY 2016 

FY 2017

Fy 2018
Año fiscal 2019
Año fiscal 2020

Recycled

1,045,093

904,883

849,498

831,576

968,296

Tambores de acero

689,513

534,369

571,355

509,884

562,980

Poly Drums

277,672

212,272

161,447

243,186

358,280

IBC (Contenedores a granel)

77,908

158,242

116,696

78,506

47,036

Reconditioned

3,808,242

3,218,885

3,258,848

3,533,358

3,276,259

Tambores de acero

3,072,348

2,565,052

2,713,025

2,699,393

2,483,485

Poly Drums

375,307

321,188

244,497

194,011

178,627

IBC (Contenedores a granel)

360,587

332,645

301,326

639,954

614,147

Total Collected

4,853,335 

4,136,828

4,105,936

4,348,706

4,164,585

Tambores de acero

3,761,861

3,099,633

3,284,380

3,193,049

2,971,549

Poly Drums

652,979

535,460

405,944

437,197

536,281

IBC (Contenedores a granel)

438,495

501,735

415,612

718,460

656,755

Virgin Materials Saved by Reconditioning and Reuse (Metric Tons)**

71,573

63,111

63,587

76,415

71,149

Steel

65,743

56,200

57,664

66,860

62,016

High-Density Polyethylene

5,830

5,150

4,243

5,897

5,553

Wood


1,761

1,680

3,659

3,580

Virgin Materials Saved by Recycling (Metric Tons)***

17,402

18,755

16,644

14,117

14,358

Steel

13,288

13,463

12,697

10,273

10,215

High-Density Polyethylene

3,817

4,580

3,385

3,402

3,871

Wood

297

712

562

442

272

Notes:

  1. Virgin Materials Saved by Reconditioning and Reuse data has been restated to standardize units across regions.
*Estimated Drums and Intermediate Bulk Containers (IBCs) Recycled and Reconditioned (North America and Europe, Middle East and Africa)
**Estimates based on the quantity of reconditioned packaging and average packaging specifications (North America and Europe)
***Estimates based on the quantity of recycled packaging and average packaging specifications (North America and Europe)

REBU – ESTIMATED FIBCS RECONDITIONED (EMEA)*


FY 2017

FY 2018

Fy 2019

Año fiscal 2020

 Total FIBCs Collected - 316,324

275,732

242,000

Reconditioned

 -

224,418

179,912

167,000

Recycled

 -

91,906

95,820

75,000

Total Virgin Polyethylene Saved (Metric Tons)**

 -  727.6 

634.2

556.6
Virgin Polyethylene Saved by Reconditioning and Reuse (Metric Tons)**

 -

516.2

413.8

384.1

Virgin Polyethylene Saved by Recycling (Metric Tons)***

 -

211.4

220.4

172.5

*Estimated Flexible Intermediate Bulk Containers (FIBCs) Recycled and Reconditioned (Europe, Middle East and Africa)
**Estimates based on the quantity of reconditioned packaging and average packaging specifications (Europe)
***Estimates based on the quantity of recycled packaging and average packaging specifications (Europe)
Historias destacadas

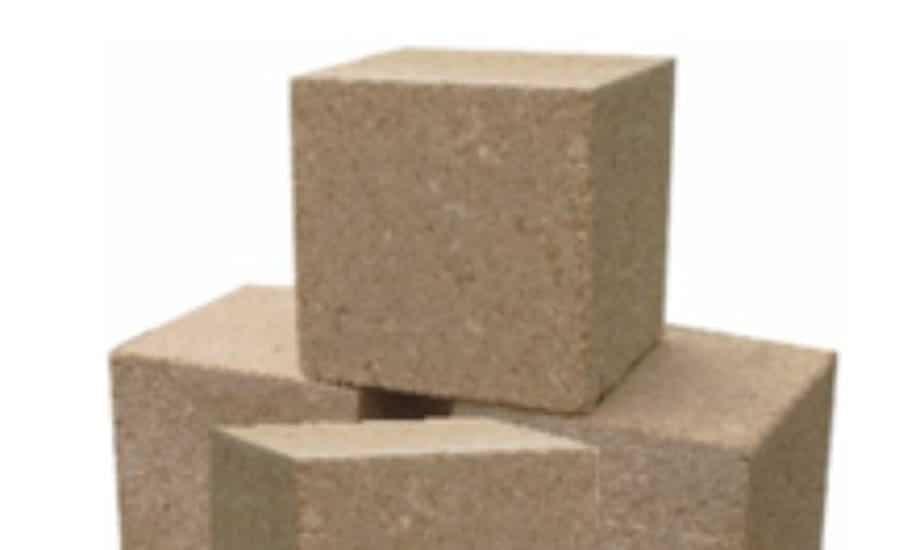
Sawdust Waste Recycling in Omsk

In July 2020, Greif’s Global Industrial Packaging (GIP) facility in Omsk, Russia implemented an innovative means of reducing their wood waste to landfill by turning their sawdust into insulation. During the production of the Clovertainers the facility generates up to seven tons of sawdust annually which represented their largest source of waste and 39 percent of their waste that was being sent to landfill. To reduce their waste to landfill, the team began searching for recycling solutions for the sawdust and discovered they could process it into components for pallet production. Once processed, it can be sold to farmers for use as insulation for their livestock in the winter or to construction companies to be used as fuel. As a result, they have reduced their waste to landfill and realized cost savings.

highlight Sawdust min 1
Historias destacadas

Turning Waste to Fuel

In 2019, Greif collaborated with one of our waste management partners to identify materials used in our operations that could enter their engineered fuels program, which aims to identify materials that have a high heat value such as plastics, oils and absorbents, that can be used as fuel in certain applications that require significant amounts of energy, such as cement kilns. Through this collaboration, polypropylene lids used on Greif’s fibre and plastic drums were identified as strong options to enter this program. Since these lids cannot be recycled, Greif’s Naperville, Illinois facility collected and palletized 3.3 tons of lids to enter into this program. Without this program, the lids would have been sent to landfill. This program is available to Greif North American facilities.

highlight waste to fuel min 1
Historias destacadas

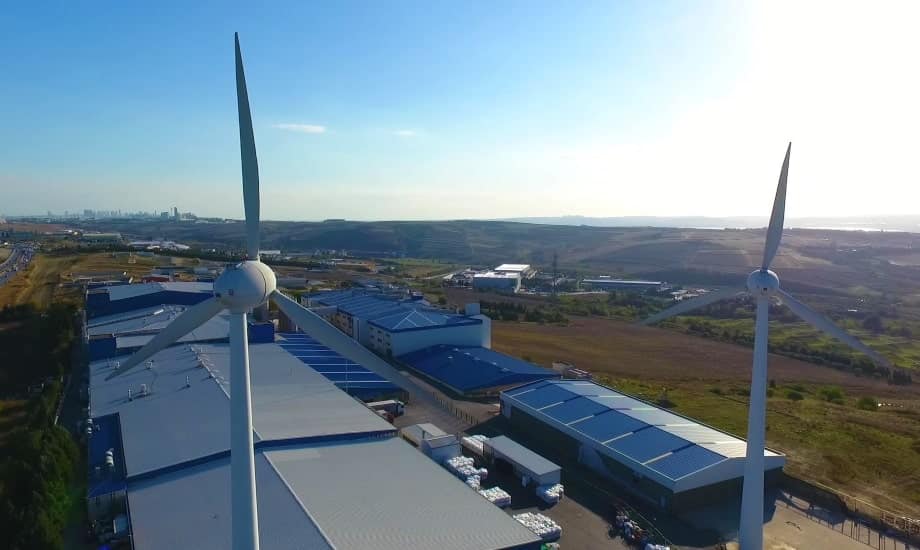
Greif Hadımköy Reaches and Exceeds 90 Percent Waste Diversion Target

During 2020, the Hadımköy team in Turkey developed a waste roadmap by assessing their waste streams and determining a path to reduce their waste going to the landfill. The Hadımköy team introduced separation bins for paper waste in production, separated leftover food waste and sent it to local animal shelters, and introduced separation bins for packaging and paper waste in the cafeteria. In total, these efforts led to a seven percent reduction in their waste to landfill. By the end of 2020, Hadımköy used the projects on their waste roadmap to further reduce their waste to landfill an additional five percent and already exceeded the corporate 2025 waste target.

highlight Hadimkoy min 1
Historias destacadas

Reducing VOC’s Through Use of Water-Based Exterior Paints

Greif is committed to using water-based exterior paints in our operations where possible, rather than high volatile organic compound (VOC) exterior paints. In Global Industrial Packaging (GIP) North America, eight out of our nine steel plants use water based paints. In GIP China, the Greif Zhuhai plant has converted to 70 percent water-based paints and in 2020, they began testing the use of water based regular drum liners in our products to further reduce the VOC impact of our products.

highlight automaticunloadingsystem min 1
Historias destacadas

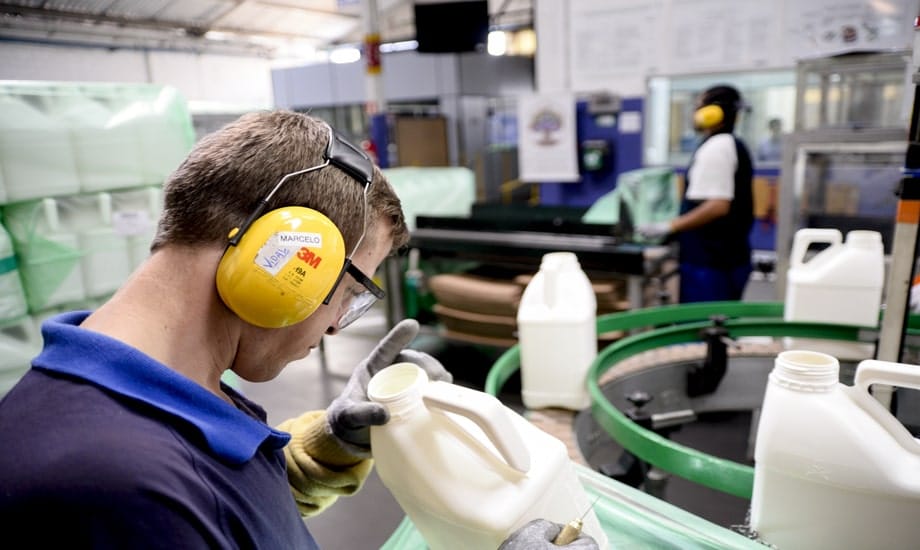
Achieving Waste Reduction through Customer Service Excellence

In 2019, Greif’s Global Industrial Packaging (GIP) facility in Sweden received a customer complaint that jerrycans were being damaged during unpacking because the plastic film used to wrap the pallets was too tight and difficult to remove. In response, the facility tested a number of film alternatives that were easier to remove and posed less risk of damaging the cans and ultimately selected an alternative that reduced the use of film by 48 percent, saving 7500 kg of materials annually. The transition also led to $12,000 USD savings and a 22,000 kg emission reduction. In order to scale the project, the team has updated the standard operating procedure for using similar films and have worked with our procurement team to update the supplier and material for the film.

highlight photos 2019 min 1
Historias destacadas

Greif Riyadh Reduces Waste by Addressing Wastewater

In 2017, Greif’s Global Industrial Packaging (GIP) facility in Riyadh, Saudi Arabia was the largest contributor of waste to landfill in the EMEA region with 36 percent of waste going to landfill. By analyzing their waste streams, the facility team determined that this was primarily due to wastewater that, if treated properly, could be recycled. Despite limited infrastructure support, availability of recycling partners and transportation options, the team established a process to internally separate and clean water to acceptable levels for local transporters and recyclers and consistently return water to them. Through these measures, the team reduced the oil content of the water from 60 ppm to 1.5 ppm and decreased their waste-to-landfill to four percent by the end of 2019. Due to Saudi Arabia’s own water scarcity, the impact of this initiative goes far beyond Greif’s operations. Through initiatives like this Greif has the ability to set a precedent for other businesses to follow and ultimately benefit the local community.

highlight photos 2019.04 min 1
Historias destacadas

Removing Solvents in IBC Printing

Greif’s Global Industrial Packaging (GIP) facility in Falkenberg, Sweden implemented an innovative printing process for intermediate bulk containers (IBCs) that reduces waste, eliminates the use of solvents in printing and generates efficiencies in the manufacturing process. By replacing traditional ink jet printing with laser engraving to mark IBCs, the team has eliminated ink-based solvents from the manufacturing process and the need to change printing plates between production runs, creating a more efficient facility, and reduce the amount of resin required by 6.7 percent. In total, this change will lead to $50,000 annual savings and can easily be implemented in other Greif facilities.

highlight IBC solvent markings 1 min 1

SUSTAINABILITY HIGHLIGHTS

71%

Of waste diverted from landfills

Our efforts to reduce waste are global, with each facility working towards our 2025 goal.

39

Facilities Achieving Zero Waste to Landfill

¿NO VES TU IDIOMA?

Utilice Google Translate para elegir su idioma de la lista utilizando la barra de herramientas en la parte superior de la página.